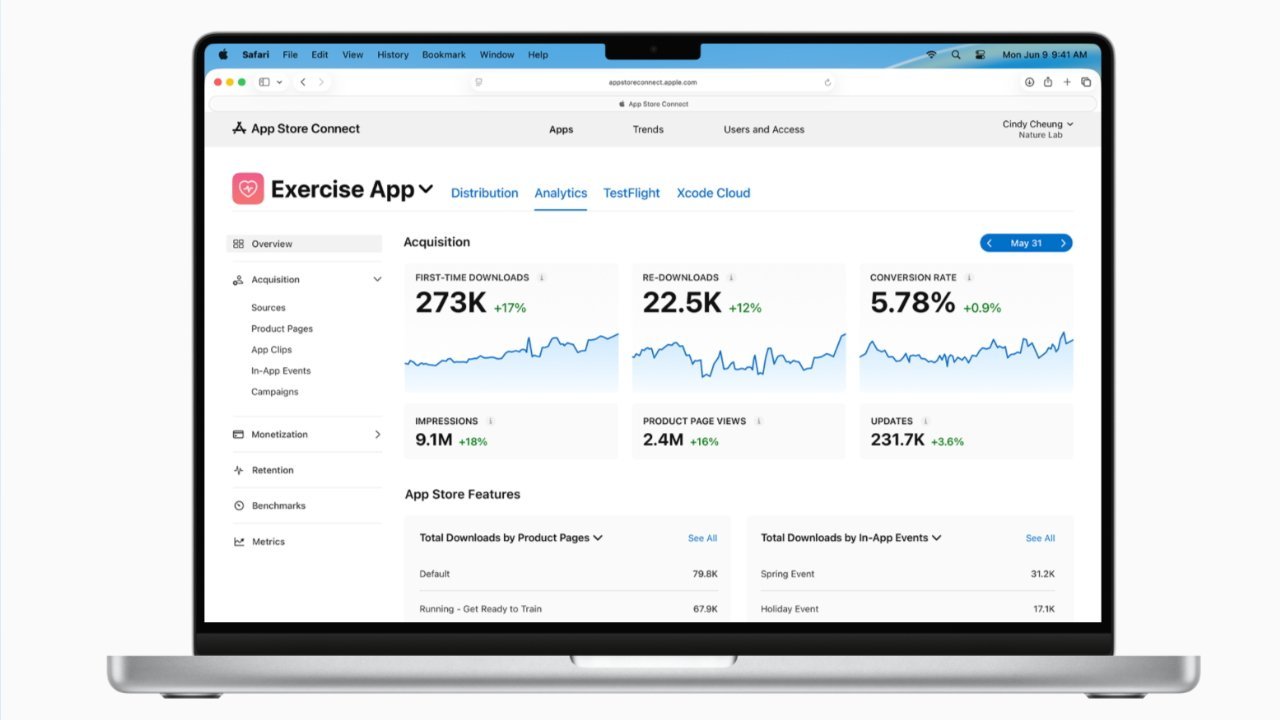
Apple has introduced what it describes as the largest update to App Store Connect since the service launched in 2018, adding more than 100 new metrics aimed at helping developers track business performance in much greater detail.
The refreshed analytics tools are built to give developers a clearer view of how apps are discovered, downloaded, and monetized. Apple says teams can now monitor trends around in-app purchases, compare performance against benchmarks, and break results down by factors such as region and user device type.
One practical change is that the interface now emphasizes the single-app view first, instead of forcing users to begin with a broad overview of every product and then drill down step by step. Apple is also reworking sales reports so that the most important figures, including total paying users and overall revenue, are surfaced more quickly.
Another major addition is a new Cohort section. That area is designed to show how long trial users typically take to convert into paying customers, which could make it easier for subscription-based apps to understand when users are most likely to commit.
For developers running app subscriptions, Apple says the new analytics experience includes more than 50 filters for examining details such as churn and the timing of subscription starts. The idea is to make recurring-revenue analysis more useful without requiring teams to stitch data together from multiple dashboards.
Apple also notes that developers do not need to add any extra code inside their apps to access these new metrics. The data can be viewed through the web dashboard and the App Store Connect apps on iPhone and iPad, and it is also available through a dedicated API for teams that want to pull the numbers into their own reporting workflows.
Taken together, the changes suggest Apple is pushing App Store Connect further beyond basic reporting and turning it into a more serious business intelligence layer for developers focused on subscriptions, monetization, and long-term app growth.